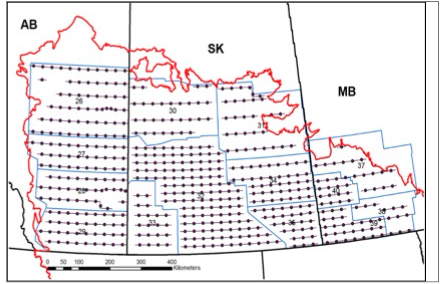
Making use of extensive long-term population monitoring, we’ve created a spatial data set like no other. The United States Fish and Wildlife Service and Canadian Wildlife Service have jointly flown breeding pair waterfowl surveys across the PHJV in both the US and Canada since 1961 (Figure). We compiled these transect data at the finest scale, coupled with underlying habitat such as ponds and potential nesting cover, to create a “duck density surface” for the five most abundant dabbling duck species in prairie Canada: mallard (Anas platyrhynchos), northern pintail (Anas acuta), blue-winged teal (Spatula discors), northern shoveler (Spatula clypeata), gadwall (Mareca strepera); and the two most abundant diving duck species; redhead (Aythya americana), and canvasback (Aythya valisineria).
Prairie Parklands (PP) Waterfowl
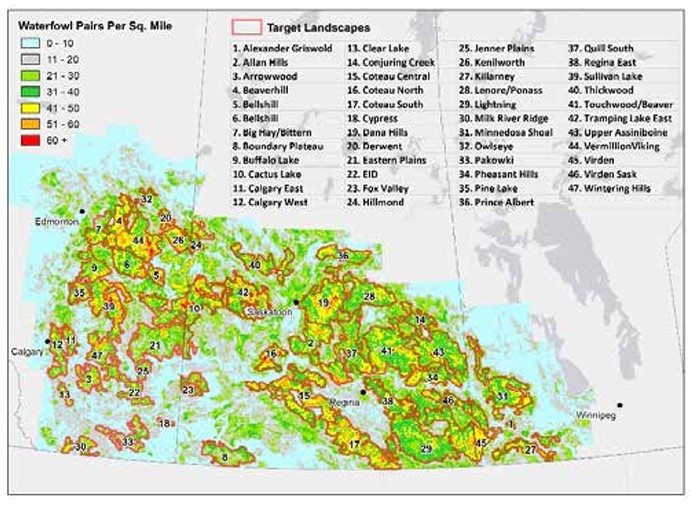
To estimate the spatial distribution of waterfowl breeding pairs (i.e., duck density) across the PHJV, we examined long-term waterfowl count data (1961-2009) at the survey segment level relative to multiple associated landscape-scale habitat covariates extracted in GIS software. We used statistical software to generate predictive equations that could then be applied to digital habitat layers with GIS to create a map of the long-term average predicted duck density across prairie Canada. This layer has been used to define the Waterfowl Target Landscapes referenced throughout the PHJV Prairie Parklands Implementation Plan (Figure).
Prairie Parklands (PP) Waterbirds, Shorebirds, and Landbirds
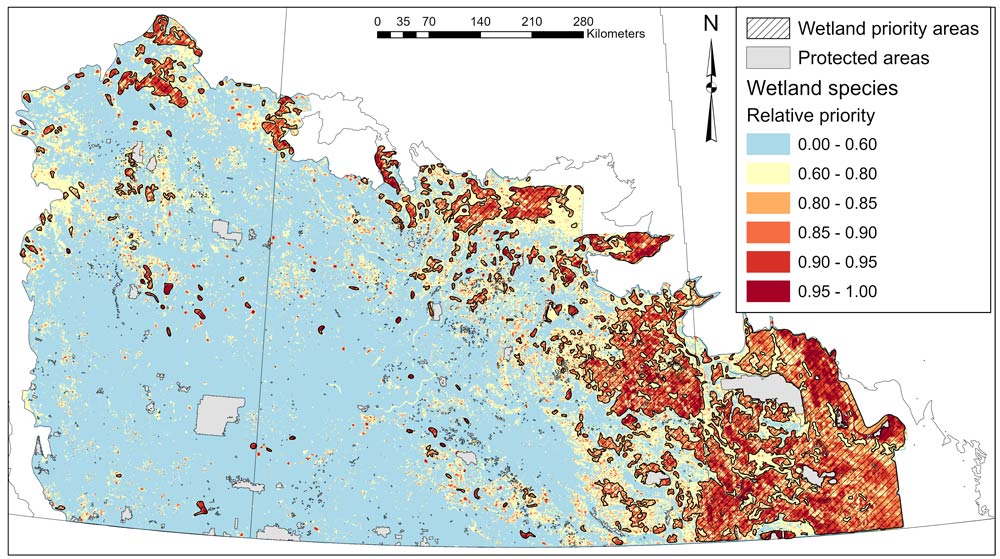
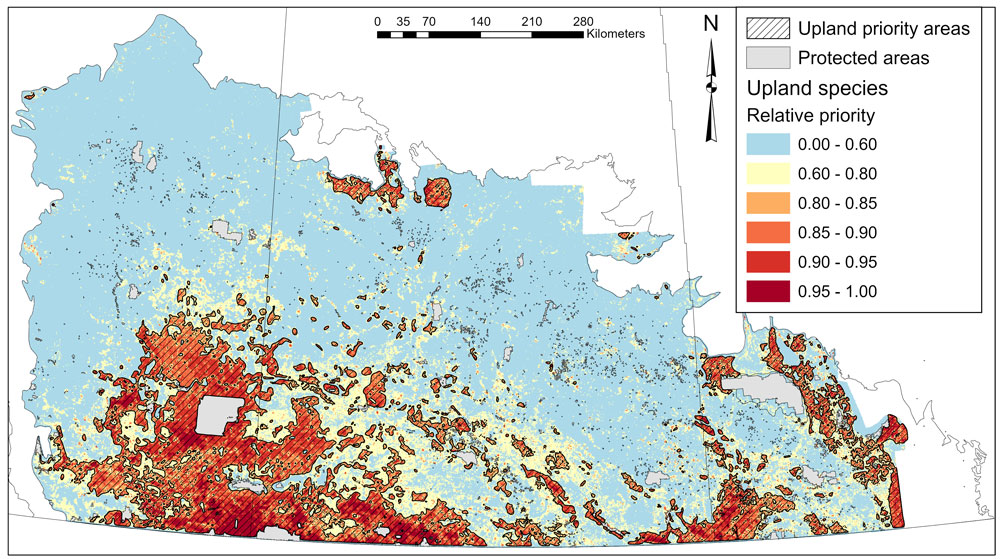
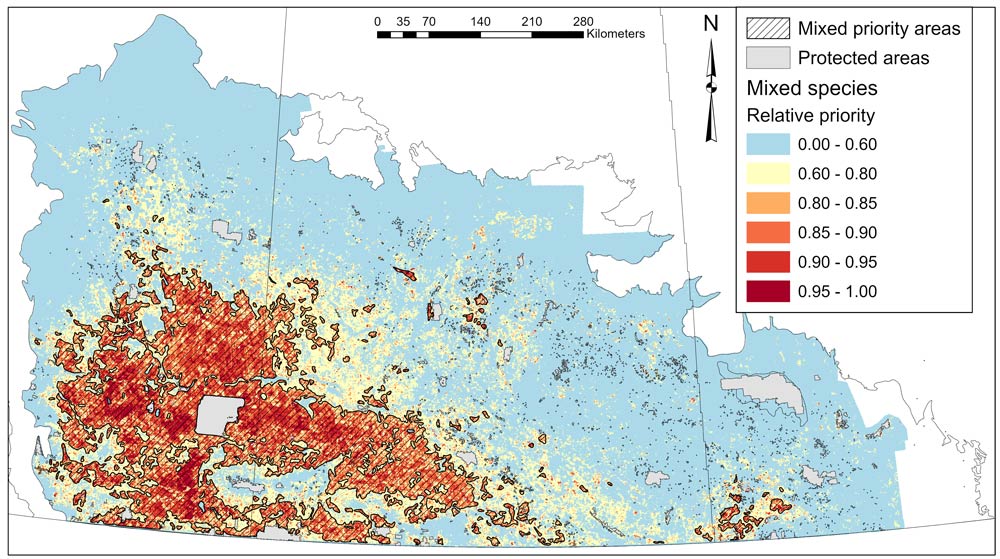
As the PHJV transitions to a more all-bird focus, the latest Implementation Plan now considers non-game birds in conservation planning efforts. Similar to the PHJV Target landscapes, species distribution models were used to identify priority areas separately for landbirds, waterbirds and shorebirds. By overlapping these priority areas with waterfowl target landscapes, we were able to identify potential co-benefits of waterfowl conservation initiatives for non-game birds.
Avian data for the density models came from the BAM avian dataset (v. 4; data collected between 1991 and 2018) and was supplemented with automated recording unit (ARU) data from the WildTrax acoustic database. For the models, separate boosted regression tree models were used to predict densities at a 1-km resolution across geographic sub-regions (bird conservation regions intersected by jurisdiction boundaries) based on covariates such as forest age, tree species biomass (local and landscape scale), topography, land use and climate. More information about these models.
Prior to identifying priority areas, species were assigned to two groups based on their association with a primary breeding habitat (as defined by Rosenberg et al. 2019) and were either (a) 93 forest-associated species or (b) seven wetland-associated species. Species were ranked according to their conservation status weight.
Western Boreal Forest (WBF) Waterfowl
In the WBF, work continues with Ducks Unlimited Canada mapping and classifying a noteworthy 25 per cent (362 million acres) of the WBF to better inform wetland and waterfowl planning across the landscape.
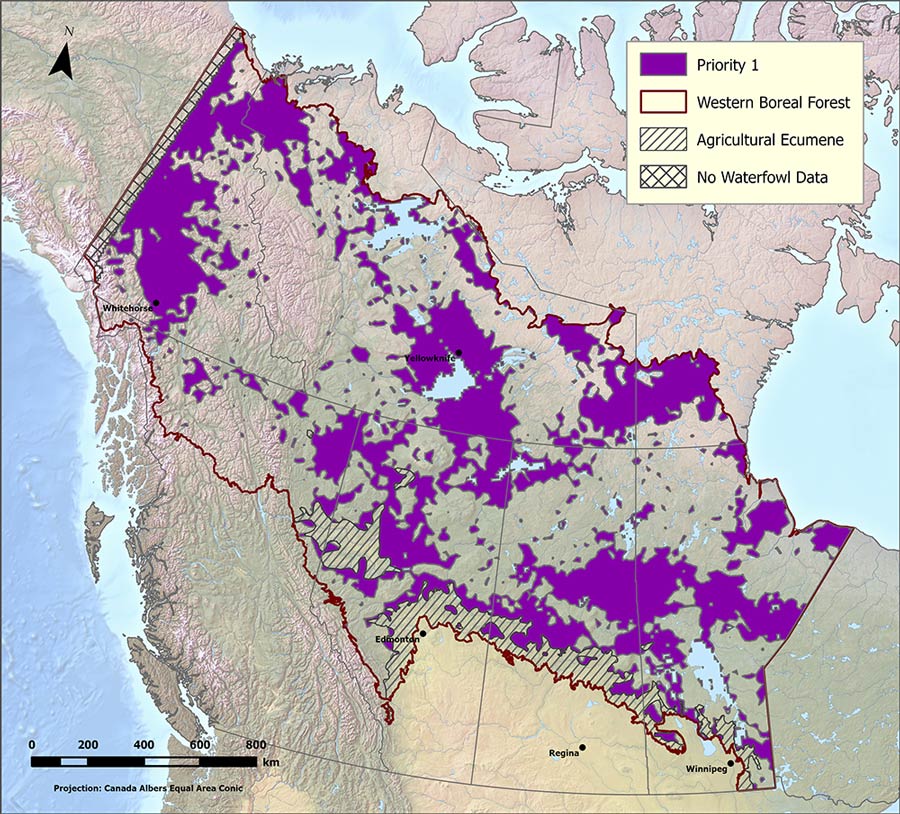
To identify WBF priority areas for waterfowl, DUC used the decision-support tool Zonation and opted to evaluate key high-density areas selected most frequently across a range of scenarios.
The analysis focused on the WBF region with the agricultural portions of the boreal transition zones (BTZ) removed. This area differs slightly from the PHJV WBF region. The main data source was predicted waterfowl densities modelled by Barker et al. (2014a, 2014b). This is comprised of 17 waterfowl species of which eight are boreal forest-specific species and account for approximately 80% of waterfowl abundance in the WBF.
The WBF analysis was used to highlight the highest priority areas in the WBF (Figure 2). The priority areas identified consist of the top 40% of waterfowl habitat which corresponds to approximately 56% of the total estimated waterfowl population of the WBF.

