PHJV Prairie Parklands Achievements from 1986 to 2022
8.5 million
3 million
(eg. wetland and grassland restoration)
8 million
2013-2020 Achievements
Habitat Restoration & Retention
| DIRECT NAWMP | EXTENSION NAWMP a | TOTAL | |
|---|---|---|---|
| Habitat Restoration | |||
| Tame Pasture | 106,026 | 55,847 | 161,874 |
| Tame Hay | 73,735 | 163,118 | 236,853 |
| Planted Cover | 26,696 | 1,077 | 27,773 |
| Wetlands | 6,675 | 274 | 6,948 |
| Sub-total | 213,132 | 220,317 | 433,448 |
| Habitat Retention | |||
| Wetlands | 121,997 | 56,272 | 178,269 |
| Upland | 275,230 | 338,301 | 613,531 |
| Sub-total | 397,227 | 394,573 | 791,800 |
| Grand Total | 610,359 | 614,889 | 1,225,248 |
| a Includes securement of Community Pastures. Tables and impacts on other birds and policy 2013-2020 | |||


Impacts on Duck Productivity
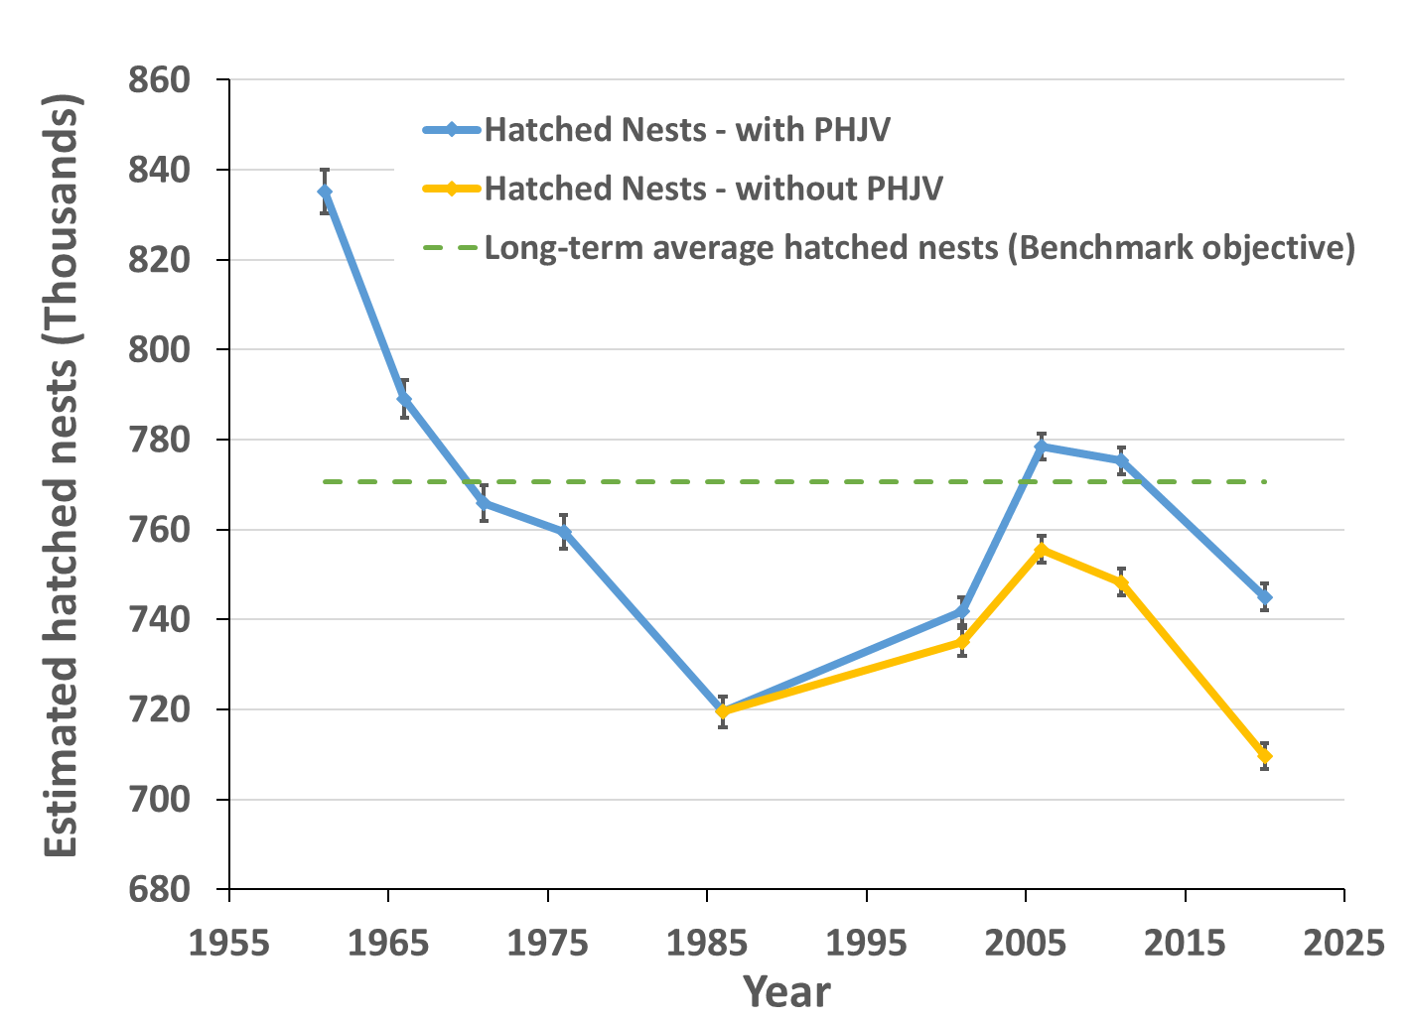
Estimated hatched nests (± 1 standard deviation) of the five main dabbling duck species with and without PHJV habitat programs relative to the long-term average estimated hatched nests representing the PHJV population goal (green dashed line).
Estimates were derived from the Waterfowl Productivity Model with estimated upland habitat composition including/excluding PHJV habitat and wetland loss impacted breeding pair populations in 1961, 1966, 1971, 1976, 1986, 2001, 2006, 2011 and 2020.

Impacts on Other Birds
In order to assess potential benefits of past conservation projects for non-game bird groups funded by the North American Wetlands Conservation Act (NAWCA), we calculated the percentage of projects that occurred within overlapping priority areas defined for upland-associated species, wetland-associated species, and species associated with both uplands and wetlands (mixed species). Details of how priority areas were defined are described below (Conservation Planning – Biological Foundations).
Of 5,922 quarter sections where NAWCA-funded projects occurred from 1989–2019, 13%, 39%, and 7% occurred in priority areas for upland, wetland, and mixed priority species, respectively, while 51% fell outside of non-game priority areas. For comparison, 71% of quarter sections occurred in Waterfowl Target Landscapes. Not surprisingly, NAWCA- funded projects, given their wetland focus, disproportionally benefit waterfowl and wetland-dependent species.
This simple analysis highlights the need for additional conservation funding targeted to priority areas outside of Waterfowl Target Landscapes.
Policy Achievements
- PHJV partners were involved in the development of Alberta’s wetland policy and several key wetland policy frameworks were advanced towards adoption in the Yukon and Manitoba. There was ongoing progress towards the development of wetland policies in the Northwest Territories, Saskatchewan and British Columbia.
- Wetland inventories were completed across over 150 million acres in multiple jurisdictions that support the implementation of wetland policies, among other uses, including assessing carbon storage and sequestration, and habitat suitability of other wildlife species.
- PHJV partners produced a report outlining all desired key components of a successful wetland policy to guide future policy development. This advanced our ability to track, evaluate and monitor various policies being developed in different jurisdictions and is a key requirement for wetland policies developed by PHJV partners to leverage support for these activities.
Western Boreal Achievements from 1986 to 2021
12.1 million
121.1 million
2013-2020 Achievements
Distribution of predicted waterfowl breeding population
| JURISDICTION | WATERFOWL (% OF WBF TOTAL) |
WATERFOWL HABITAT (% OF WBF TOTAL) |
AREA (% OF WBF TOTAL) |
|---|---|---|---|
| ALBERTA | 10.8 | 6.7 | 11.7 |
| BRITISH COLUMBIA | 5.3 | 5.1 | 9.5 |
| MANITOBA | 13.3 | 20.3 | 16.5 |
| NORTHWEST TERRITORIES | 31.4 | 42.1 | 31.5 |
| NUNAVUT | 4.6 | 6.1 | 3.3 |
| SASKATCHEWAN | 11.5 | 13.8 | 11.8 |
| YUKON | 23.1 | 5.9 | 15.6 |
Distribution of predicted waterfowl breeding population, waterfowl habitat, and proportion of total WBF area among PHJV jurisdictions.


Objective and accomplished acres
| JURISDICTION | TOTAL PROTECTED LANDS (‘000s ACRES) |
TOTAL SUSTAINABLE LAND USE AREAS (‘000s ACRES) |
||
|---|---|---|---|---|
| OBJECTIVE | ACCOMPLISHED | OBJECTIVE | ACCOMPLISHED | |
| ALBERTA | 7,500 | 6,563 | 26,100 | 0 |
| BRITISH COLUMBIA | 400 | 0 | 800 | 0 |
| MANITOBA | 3,300 | 334 | 700 | 6,092 |
| NORTHWEST TERRITORIES | 15,600 | 7,200 | 16,800 | 0 |
| SASKATCHEWAN | 300 | 1,706 | 5,400 | 0 |
| YUKON | 3,800 | 41,410 | 4,100 | 5,605 |
| TOTAL | 30,800 | 57,213 | 53,700 | 11,697 |
Objective and accomplished acres (‘000s) claimed as influenced through PHJV activities in the WBF, 2014—2020. Acres claimed from 2001—2013 are found in the previous 2013—2020 report and no acres were claimed prior to 2001. Areas of influence may extend beyond the PHJV WBF boundaries, but do not include any areas fully outside of the PHJV.
PHJV waterfowl habitat objectives
| JURISDICTION | TOTAL PROTECTED LANDS (‘000s ACRES) |
TOTAL SUSTAINABLE LAND USE AREAS (‘000s ACRES) |
||
|---|---|---|---|---|
| OBJECTIVE | ACCOMPLISHED | OBJECTIVE | ACCOMPLISHED | |
| ALBERTA | 7,500 | 6,563 | 26,100 | 0 |
| BRITISH COLUMBIA | 400 | 0 | 800 | 0 |
| MANITOBA | 3,300 | 334 | 700 | 6,092 |
| NORTHWEST TERRITORIES | 15,600 | 7,200 | 16,800 | 0 |
| SASKATCHEWAN | 300 | 1,706 | 5,400 | 0 |
| YUKON | 3,800 | 41,410 | 4,100 | 5,605 |
| TOTAL | 30,800 | 57,213 | 53,700 | 11,697 |
| Objective and accomplished acres (‘000s) claimed as influenced through PHJV activities in the WBF, 2014—2020. Acres claimed from 2001—2013 are found in the previous 2013—2020 report and no acres were claimed prior to 2001. Areas of influence may extend beyond the PHJV WBF boundaries, but do not include any areas fully outside of the PHJV. | ||||

Impact on Other Birds
| SPECIES | |||
|---|---|---|---|
| JURISDICTION | CAWA | OSFL | RUBL |
| PERCENT AFFECTED | PERCENT AFFECTED | PERCENT AFFECTED | |
| ALBERTA | 3.9% | 6.2% | 3.6% |
| BRITISH COLUMBIA | 0.0% | 0.0% | 0.0% |
| SASKATCHEWAN | 1.9% | 2.0% | 1.3% |
| MANITOBA | 6.0% | 1.0% | 0.1% |
| NORTHWEST TERRITORIES | 4.0% | 3.4% | 1.3% |
| YUKON | 41.4% | 40.9% | 37.5% |
| NUNAVUT | 0.0% | 0.0% | 0.0% |
| WBF TOTAL | 8.7% | 10.5% | 3.5% |
| Percent of Canada Warbler (CAWA), Olive-sided Flycatcher (OSFL) and Rusty Blackbird (RUBL) populations affected by PHJV Western Boreal Forest habitat conservation programs 2013—2020. | |||

